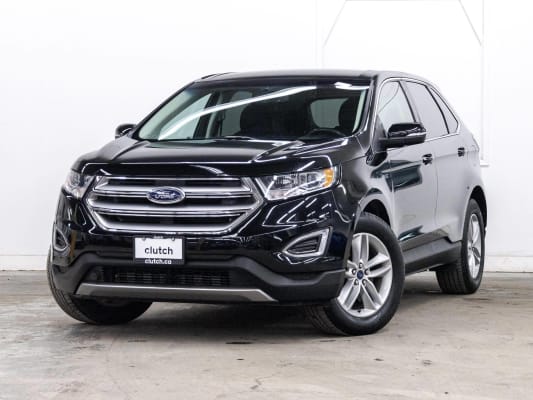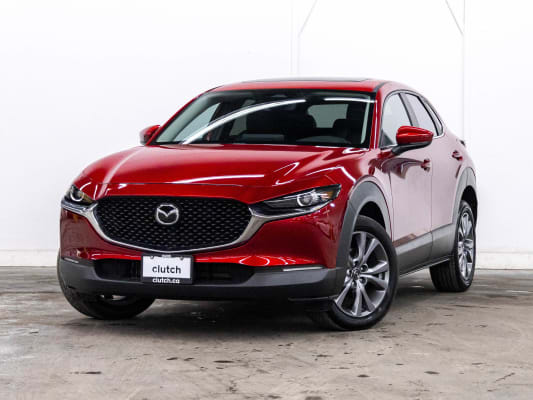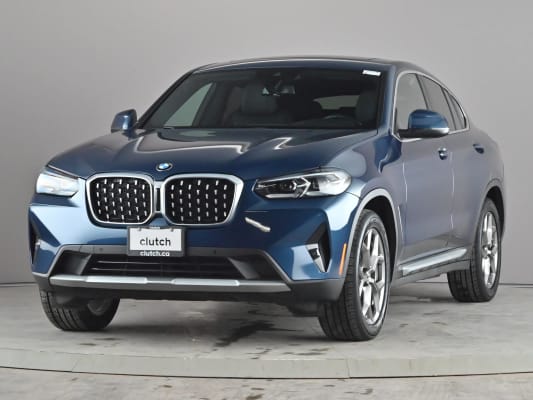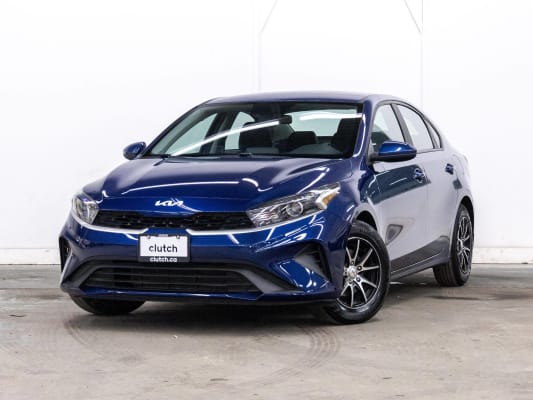
June 2026 at a glance
- National average used price is $34,134: down 0.1% on the month, up 1.6% on the year, and essentially flat since September 2025.
- The yearly rise is all trade-up: comparing the same model at the same age, a comparable vehicle costs about 1.3% less than a year ago. 39 of the 50 top-selling models are cheaper on that basis.
- New-vehicle sales are down 5.1% so far in 2026 while used-vehicle sales grew. Canadians are shifting to the used market.
- Used EVs sold in a median 24 days, the fastest of any fuel type and the lowest on record, as the spring supply wave finished clearing. EV share settled at 3.9%.
- Hybrid share held near its record at 6.7%, with comparable hybrids about 6% cheaper than a year ago.
- SUVs set another record at 63.5% of purchases; Quebec and Atlantic Canada combine the fastest price growth with the best affordability.
National Overview
Canada's average used vehicle sold for $34,134 in June, down 0.1% from May and up 1.6% from a year ago.
That 1.6% needs unpacking, because the cars themselves didn't get more expensive. What changed is what Canadians drove home.
Here's the math behind the chart. Buyers shifting toward newer, larger, and more electrified vehicles added about $784 to the national average over the past year. New models entering the used market for the first time added another $211. And the price of a comparable vehicle, meaning the same model at the same age, actually fell about $450, or 1.3%. Add it up and you get June's higher average sitting on top of a slightly cheaper market.
The pattern holds almost everywhere you look. 39 of the 50 most-purchased models in Canada cost less than they did last June, comparing the same model at the same age. The softening is gentle and remarkably even, running 1% to 2% across every body style and fuel type. It's steepest for one-to-three-year-old vehicles, down about 2.2%, while vehicles seven years and older held their value almost exactly.
The used market is also carrying more of the country's demand. Official data shows new-vehicle sales down 5.1% through the first four months of 2026, while used-vehicle retail sales rose 5.8% year-over-year in the latest official month. June brought the new market its first yearly gain in nine months, an estimated 1.9%, though the calendar did some of the work: dealerships don't sell on Sundays, and this June had one fewer Sunday than last, meaning one extra selling day. Count it per selling day and the new market was roughly flat. The pattern of the year is clear: when new gets expensive, Canadians go used. So far, that shift hasn't pushed used prices up. Buyers are spending the same and simply getting more vehicle for it.
Where prices moved, though, depends a lot on where you live.
Province by Province

The country split east-west in June. New Brunswick led yearly price growth at +5.7%, with Nova Scotia close behind at +5.5% and Manitoba at +5.1%. Quebec rose 3.2% to $30,454. Meanwhile the three most expensive provinces all sat flat or lower than a year ago: Alberta averaged $37,386 (down 1.0%), Saskatchewan $37,128 (down 1.0%), and British Columbia $37,113 (down 0.1%).
Notice the pattern? The affordable provinces are the ones appreciating. Quebec and Atlantic Canada still offer the country's lowest prices, with Prince Edward Island at $28,187 and Newfoundland and Labrador at $30,102, but that gap is narrowing as value-hunting buyers push those markets up. Prince Edward Island's small market makes its monthly numbers jumpier than the rest, so treat its swings loosely.
Ontario, the country's largest used market, averaged $34,222, up 2.0% on the year but down 1.1% on the month. That monthly dip, matched almost exactly by British Columbia, is most of the reason the national average went nowhere in June.
The flat national number has been the story for a while now.
Monthly Price Trend
June's average sits within $10 of where prices stood last September. Ten months, and the national average has moved less than $600 from top to bottom. After climbing through most of 2025, the market found a ceiling last fall and has run sideways ever since.
Wholesale markets spent June leaning the other way. Canadian Black Book's weekly readings showed wholesale values falling 0.35% and then 0.50% in back-to-back late-June weeks, steeper than the typical 0.19% seasonal dip for that stretch. Wholesale tends to lead retail, which suggests the plateau is more likely to bend down than up. It hasn't yet.
A flat line on top, though, can hide a lot of movement underneath. June's real story is what happened inside the fuel mix.
Fuel Type: The EV Shelf Ran Empty
The spring EV story reached its natural end in June. EV share of used sales climbed from 4.0% in February to a peak of 5.7% in April, eased to 4.8% in May, and settled at 3.9% in June, right back where it started. The average used EV sold for $41,510, up from May, though comparable EVs didn't get pricier. The inexpensive spring inventory sold through, and what remained skewed newer and better equipped.
Why did EV sales fall back? Not because buyers lost interest. The supply ran out.
The supply line tells the whole arc. Active EV inventory climbed to 14% above its January level by early March, then drained to 22% below it by early June, a one-third drawdown from the peak, while hybrid and gasoline inventory grew right through the spring. Then, in late June, the EV line turned up. It was the first month since February where new EV listings outpaced EV sales. The rebuild has started, barely.
The selling times confirm which side was constrained. A used EV that sold in June had been listed for a median of 24 days, the shortest in our records and the first month EVs turned faster than every other fuel type, beating gasoline vehicles by six days. Cooling demand shows up as cars lingering. This is the opposite: the shelf emptied.
The new-vehicle market tells the matching half of the story. New zero-emission vehicle sales jumped 74.7% year-over-year in March and 21.2% in April, reaching 12.2% of new sales at the spring peak, helped by the federal purchase incentive. Some of those buyers would otherwise have shopped used. And each of those new EVs eventually feeds the used market as a trade-in, which is how the next supply wave forms.
Hybrids ran the same demand shift with a calmer supply story. Hybrid share held at 6.7% of sales, just under April's record, and this time supply kept pace rather than draining. That's no accident. Hybrids have been the new market's compromise choice for several years, picked by shoppers who wanted fuel efficiency and a lighter environmental footprint without EV prices or range anxiety. Those cars are now aging into the used market in steadily growing numbers, which is why the used hybrid shelf refills as fast as buyers clear it. The average hybrid sold for $42,704, still the most expensive fuel type but down 3.0% from a year ago. We expected firmer hybrid pricing this spring; the trade-in wave arrived faster than we anticipated, and prices eased instead. More than half of used hybrids now sell under $40,000. A year ago it was 45%.
Our own platform saw the same squeeze, compressed. EVs on clutch.ca sold in a median of 11 days in June, our fastest ever and roughly two and a half times quicker than our gasoline vehicles. EV search interest held about 24% above its late-January baseline even as EVs fell from over 7% of our inventory in February to around 2% at the low, before ticking up in June. Interest held. Stock ran out. Hybrid inventory, by contrast, stayed a steady 8% to 9% of our shelf all year.
The same shift in buyer preference shows up in body styles, where it's been running for years.
Body Style: SUVs Set Another Record
SUVs took 63.5% of used sales in June, the highest share in our records. The chart shows how steady the march has been: 57.3% two Junes ago, 60.5% last June, 63.5% now, almost exactly three percentage points a year, nearly all of it taken from cars, which slipped to 21.7% of sales. Trucks have held their ground near 15% throughout.
This is the single biggest force behind the rising national average.
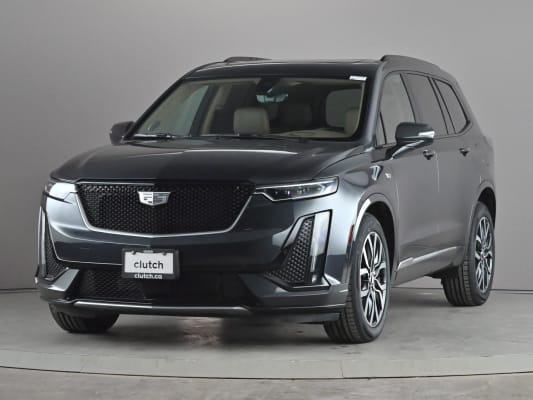
The price ladder explains why the shift moves the average. SUVs averaged $32,978 in June, roughly $8,300 more than cars, so every point of share that moves from cars to SUVs pulls the national number up without any vehicle getting more expensive. All three body styles were actually cheaper on a comparable basis than a year ago, with trucks the most stable at under a 1% decline. Trucks held an average of $47,346 on 14.8% of sales.
Canadians keep buying their way up the price ladder, one body style at a time. So what does that mean for the shopper trying to stretch a budget?
Affordability: Where the Savings Went
If comparable vehicles got cheaper, the savings had to land somewhere. They landed hardest exactly where demand shifted: the electrified market.
47.8% of used EVs sold under $35,000 in June, up from 45.6% a year ago. At the $40,000 mark, 61.5% qualified, up from 58.6%. Hybrids moved further: the share of hybrids under $40,000 jumped 6.4 percentage points in a year, the biggest affordability move anywhere in this report. Those windows did narrow from May as the discounted spring EV supply cleared, but against last June, the electrified market is meaningfully more reachable.
One number captures it. The average used Tesla Model 3 sold for $28,164 in June, about $6,000 below the average used vehicle. The best-known EV in the country is now a below-average-price car.
The standard budget tiers look steadier, and that's the trade-up effect at work again. About 20.5% of used cars sold under $15,000, 20.0% of SUVs under $20,000, and 17.9% of trucks under $30,000, all similar to last year, because buyers put their like-for-like savings toward newer and bigger vehicles rather than cheaper ones. Quebec and Atlantic Canada remain the strongest affordability regions on every measure, which is exactly why their prices are climbing fastest.
Cheaper stickers don't erase the used-EV homework. Charging access, winter range, and battery health on an older pack all still apply. On price alone, though, the electric option keeps getting easier to justify.
Top-Selling Models
Top 50 models by June 2026 sales volume
| Model | Share | Avg Price | MoM | YoY |
|---|
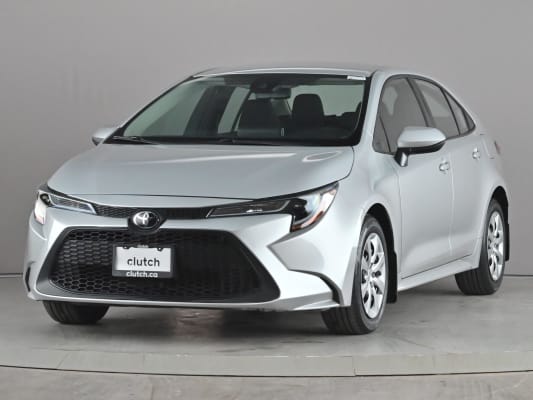
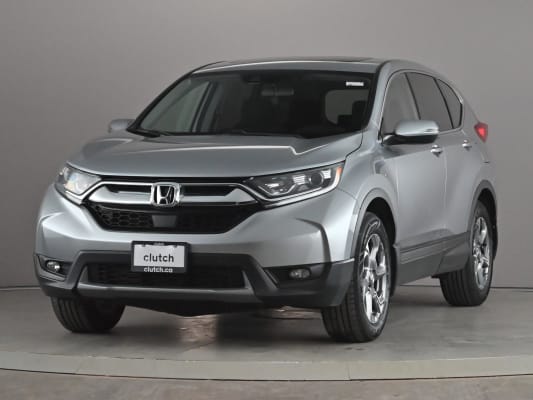
The podium barely moves: F-150, CR-V, Rogue, Civic, RAV4. What Canadians buy stays stable even as what they pay drifts down. Scan the year-over-year column in the table and it reads red almost everywhere, the 39-of-50 pattern in full.
One caveat on reading it: those figures track the average price paid for each model, so a model whose buyers shifted to newer years can show a gain even in a softening market. Which brings us to the one big exception.
Market Makers: Eight Vehicles That Explain June
The Tesla Model 3 (down 11.7% year-over-year) and Model Y (down 8.9%) anchor the EV price story, and the non-Tesla EVs fell harder still: the Chevrolet Equinox EV dropped 16.3% to $39,674, and the Bolt EUV slid 7.2% to $25,763, putting a modern EV within reach of budget shoppers. The RAV4 Hybrid, at $39,162 and down 4.5%, shows the hybrid premium easing even as hybrid share holds near its record.
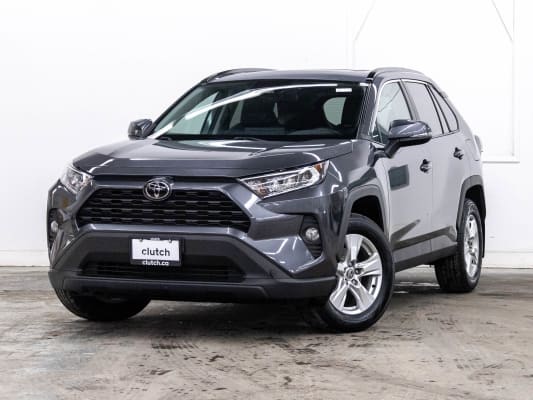
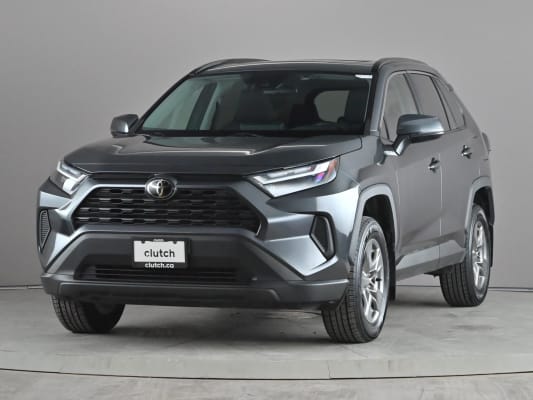
Then there's the gas Toyota RAV4, up 8.5% to $33,309. Part of that is buyers choosing newer RAV4s. But unlike nearly everything else on the road, a RAV4 of the same age genuinely costs about $1,300 more than it did last June. It's one of the only mainstream vehicles in Canada that got more expensive on a true like-for-like basis, a testament to Toyota's resale strength. The exception that proves the rule.
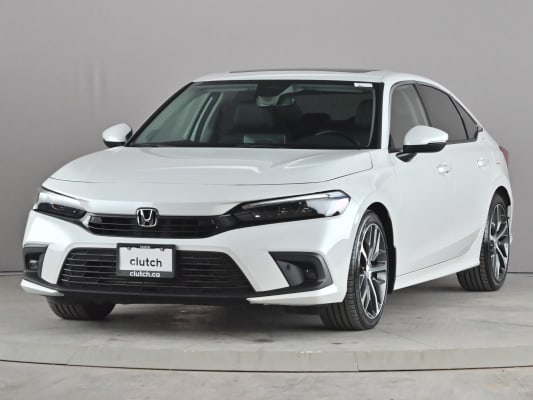
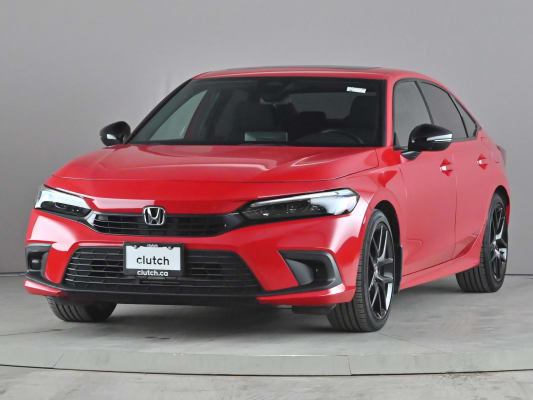
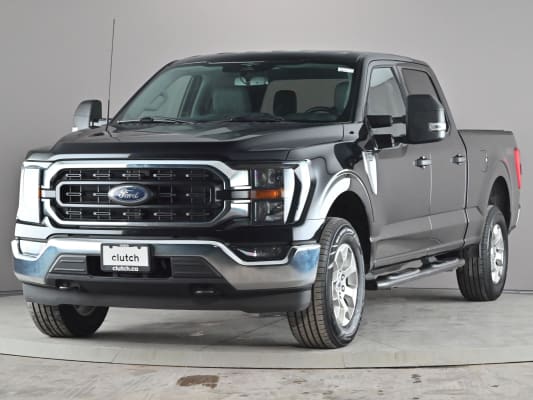
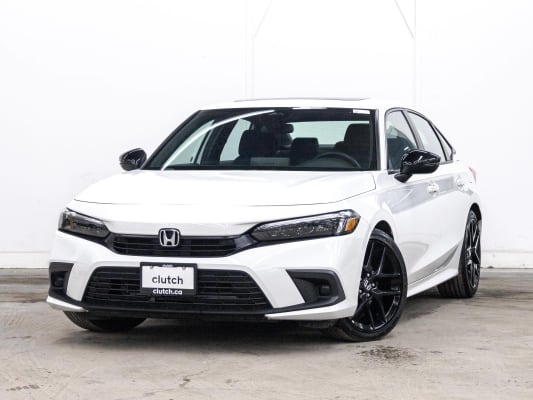
The Honda Civic (down 3.8% to $21,650) is the whole report in one household name, and the F-150, flat at $44,733, shows trucks doing what trucks do: holding value while everything around them slips.
Budget Buys
Most popular used vehicles under budget thresholds, June 2026
Cars Under $15,000
| Model | Avg Price | |
|---|---|---|
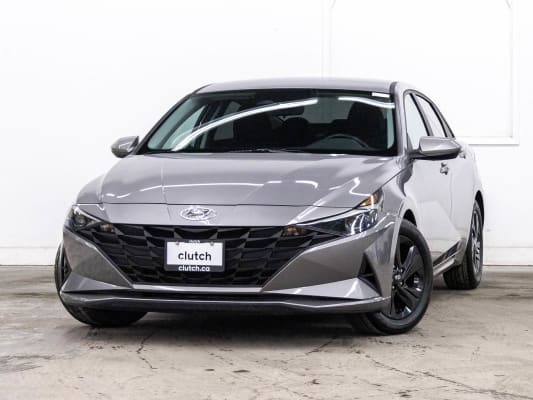
| 1 | Hyundai Elantra | $11,690 |
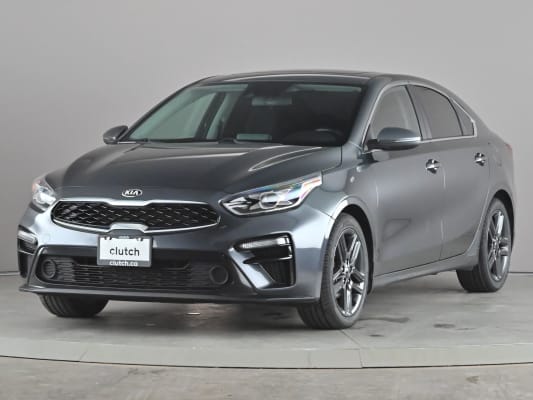
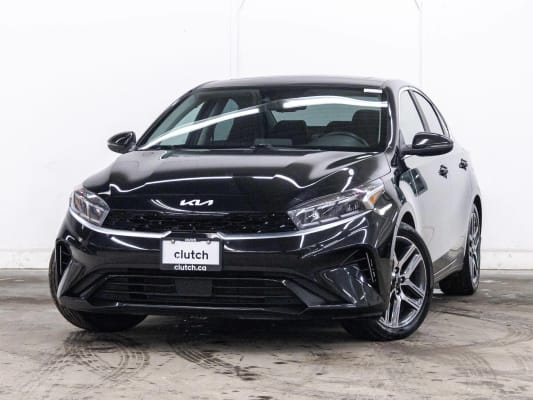
| 2 | Kia Forte | $11,767 |
| 3 | Honda Civic | $13,368 |
| 4 | Chevrolet Cruze | $11,173 |
| 5 | Kia Soul | $11,509 |
SUVs Under $20,000
| Model | Avg Price | |
|---|---|---|
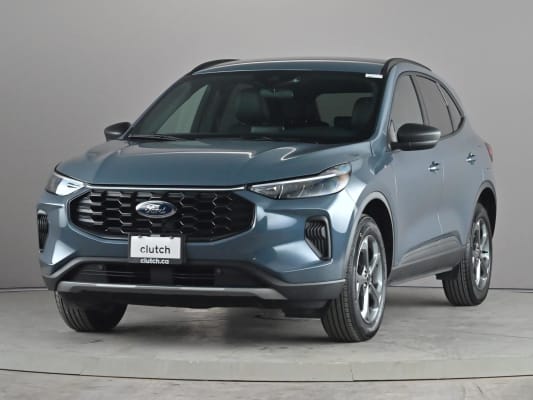
| 1 | Ford Escape | $14,817 |
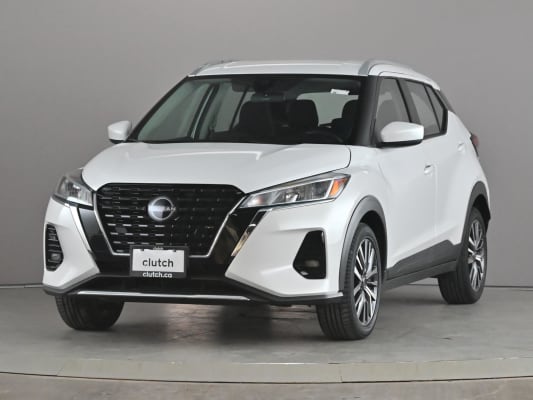
| 2 | Nissan Kicks | $16,811 |
| 3 | Nissan Rogue | $14,938 |
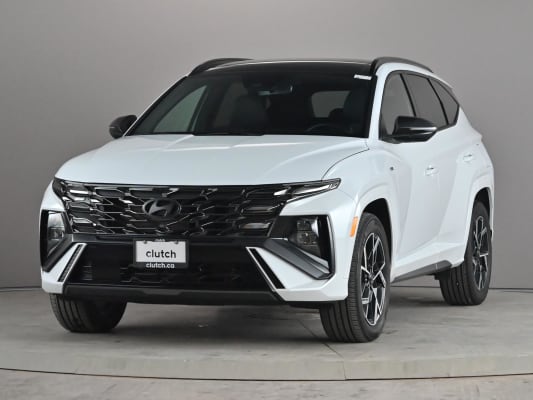
| 4 | Hyundai Tucson | $14,951 |
| 5 | Chevrolet Equinox | $15,271 |
Trucks Under $30,000
| Model | Avg Price | |
|---|---|---|
| 1 | Ford F-150 | $25,323 |
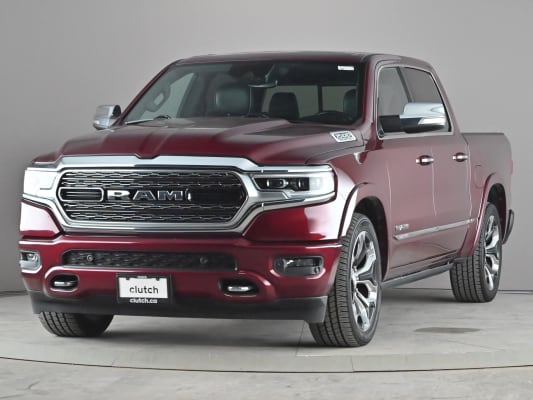
| 2 | Ram 1500 | $22,214 |
| 3 | Ram 1500 Classic | $25,624 |
| 4 | GMC Sierra 1500 | $24,538 |
| 5 | Chevrolet Silverado 1500 | $25,087 |
The affordable end of the market still runs deep. The Hyundai Elantra averaged $11,691 among under-$15,000 cars, with the Kia Forte, Chevrolet Cruze, and Kia Soul all landing under $12,000. In the SUV tier, the Ford Escape led at $14,817 under the $20,000 line. Among trucks under $30,000, the Ram 1500 averaged $22,214.
And the electric thread reaches down here too: the Bolt EUV's sub-$26,000 average puts a modern EV in budget territory.
What to Watch
The EV window should reopen. June brought the first month since February where EV listings outpaced EV sales, and our own EV inventory share turned up off its low. If the rebuild holds, expect EV share of sales to climb back toward 5% through the fall, with the affordability thresholds widening again as fresher supply lands.
Does the plateau finally break? Ten months of flat prices, with wholesale values falling faster than seasonal norms in late June, argues for softness ahead. But the SUV mix shift has spent two years propping up the headline number, and there's no sign of it slowing. We expect the average to stay pinned even if comparable vehicles keep drifting cheaper.
Hybrids look poised for a record. At 6.7% of sales with prices easing and supply keeping pace, a new hybrid share high before year-end seems more likely than not.
And the official data will test our substitution read. Statistics Canada's next releases will show whether used-market growth held through the quarter, and whether June's estimated new-vehicle gain survives confirmation in August.
About This Data
This report is based on Clutch's internal data, collected from retail vehicle sales reported across Canada. The analysis includes vehicles that meet the following criteria:
• Model year 2016 or newer
• Less than 200,000 km at the time of sale
• Sold vehicles only
References to "cars" include both sedans and hatchbacks, while SUVs and trucks are categorized separately. This segmentation helps reflect real-world buyer preferences across different body styles.
While the dataset covers a large national sample, pricing in smaller provinces or regions with lower sales volume may be influenced by individual outliers. This can lead to greater month-over-month fluctuations in certain areas compared to larger markets like Ontario, Quebec, and British Columbia.
The figures presented reflect average asking prices at the time of sale and are designed to provide an accurate snapshot of current market trends.
.avif)

.avif)
-02.avif)