September marked another step higher for Canadian used-vehicle prices, both month over month and year over year. The national average climbed modestly from August and now sits at $34,188, 7.26% above where it stood a year ago. However, pricing didn’t increase across the board: Ontario and Quebec carried the East higher, while Alberta and British Columbia pulled the West lower.
Shifts in sales composition also shaped the picture. Trucks gained ground nationally, growing in share to 15.0% of sales in September, while cars ceded share and SUVs held steady. That tilt toward pickups also meant gasoline vehicles expanded their share, while EVs and hybrids edged back from last month’s all-time high.
On pricing, all fuel types were higher in September—gasoline, hybrid, and electric alike—though the reasons varied. In some cases, like gasoline, both mix and within-model prices pushed in the same direction. In others, such as EVs, the gains were all about mix rather than stronger per-unit pricing.
The provincial picture highlights an East-West divide in pricing trends. Despite lower average selling prices, Ontario and Quebec drove national averages higher with month-over-month gains, while Alberta and British Columbia saw prices decrease.
Year over year, prices are higher across all provinces, though the magnitude differs. Ontario and Quebec once again stand out on the stronger side of the ledger with the highest gains, while Alberta and BC’s declines this month make their year-over-year increases less significant.


The national price curve has come full circle. September’s average selling price sits just above where it did in early 2024, but the market beneath the line has shifted. Last year’s mid-cycle dip brought a temporary boost in the supply of affordable options, as older, lower-priced vehicles made up more of the basket. Over the past twelve months, the line has steadily climbed back, reflecting a heavier presence of newer, more expensive models.
This is not the same kind of inflation Canadians saw during the pandemic, when every vehicle surged together. Instead, the increase comes from composition: newer more premium trucks, SUVs, hybrids, and EVs continue to take a larger share, and the >$50k bracket has grown into a bigger force. Older units remain part of the mix, but the balance has shifted toward premium vehicles that naturally transact higher.
The chart captures that story in a single curve: a valley in 2024 that marked the peak of affordability, followed by a climb driven less by sticker-price hikes and more by who’s selling. The following sections unpack these dynamics—how trucks reshaped the national mix, how EVs diverged between East and West, and how the high-end market makers are pulling averages higher even as affordability looks better than a year ago.
At the national level, September’s average selling prices looked calm, but beneath the surface, provinces pulled in different directions. Ontario’s EV ASP jumped as the mix tilted upscale—newer Tesla Model Ys, the Cadillac Lyriq, and Ford’s F-150 Lightning all took more share, while luxury entries like the BMW i7 and Mercedes EQS saw increased prices. BC went the other way: its ASP moved lower as affordable compacts like the Nissan Leaf and Chevrolet Bolt gained ground, while premium SUVs and trucks such as the Rivian R1T, BMW i4, and Tesla Model X slipped back in share and transacted for less.
By contrast, hybrids and gasoline vehicles showed steadier pricing trends, with fewer mix swings to highlight. Hybrids ticked slightly higher on the back of Toyota’s core models, while gasoline cars and trucks held close to recent averages. The quieter movement in these segments left EVs as the main source of volatility and narrative this month, underscoring how much provincial mix can swing the averages even when national numbers appear flat.
EV
The electric segment remains a paradox: the national average selling price in September ended 1.69% higher year-over-year (+$937), yet most individual EVs continue to cost less than they did a year ago. The climb is being carried by who’s selling more, not what they’re selling for. Shoppers leaned harder into the higher end of the EV market—crossover utilities and performance models—while mainstream compacts softened in price.
Month over month, the gain was modest (+$662) and came less from shifting buyer preferences than from firmer pricing on a few widely shopped nameplates. The effect is that the market feels heavier at the top even as many of those same premium models transact at thinner margins.
- Mix (up): +$4,003 YoY. Examples: Ford’s F-150 Lightning and Porsche Taycan saw sales climb, pulling the average higher despite weaker sticker prices.
- Within-model pricing (down): -$3,066 YoY. Examples: The Tesla Model 3 and Ford Mustang Mach-E both saw average selling price decrease, offsetting part of the mix lift.
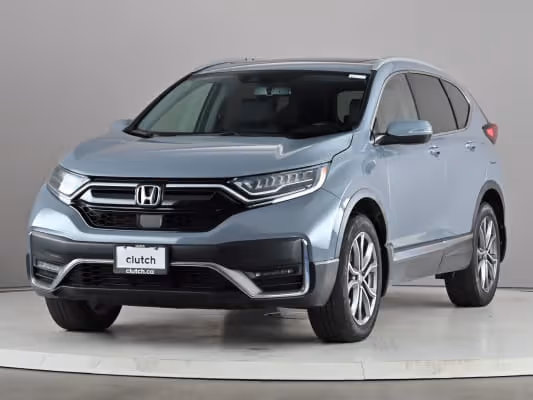
Hybrid
The hybrid market continues to evolve as a bridge between gasoline and electric, and September’s numbers underline that balancing act. The national average landed at $43,145, up just $222 month over month and $949 year over year. What’s striking is how little of that lift comes from pricing power. Instead, it’s about which hybrids Canadians are choosing.
Shoppers kept moving toward higher-spec offerings, with Toyota and Lexus hybrids anchoring the premium end of the segment. That compositional shift alone added +$885 MoM and +$1,584 YoY, while actual like-for-like prices edged lower (-$663 MoM, -$635 YoY). In other words, the hybrid basket is looking richer on paper, but each model inside it is not commanding more at the transaction level.
- Mix (up): +$1,584 YoY. Examples: Toyota RAV4 Hybrid and Sienna each gained share, steering the segment average higher.
- Within-model pricing (down): -$635 YoY. Examples: The Corolla Hybrid and CR-V Hybrid saw softer per-unit prices, holding back some of the lift from mix.
Gasoline
September underscored how the traditional gasoline market still sets the tone for used-vehicle pricing. The national average climbed to $32,314, up $311 month over month and a more pronounced $2,141 year over year. Unlike hybrids, where transaction prices have softened, gasoline vehicles saw both levers working in the same direction.
The month-to-month move was small and mostly about mix: trucks and larger SUVs took a slightly bigger slice (+$362 MoM) while individual prices held broadly steady (-$51 MoM). Year over year tells a sharper story. The heavier tilt toward pickups and full-size SUVs added +$1,433, and those same vehicles commanded firmer prices (+$708) compared with last September.
- Mix (up): +$1,433 YoY. Examples: The Ford F-150 and Toyota RAV4 gained share, shifting the gasoline basket toward higher-priced segments.
- Within-model pricing (up):+708 YoY. Examples: The Chevrolet Silverado 1500 and GMC Sierra 1500 each transacted higher YoY, reinforcing the upward push.

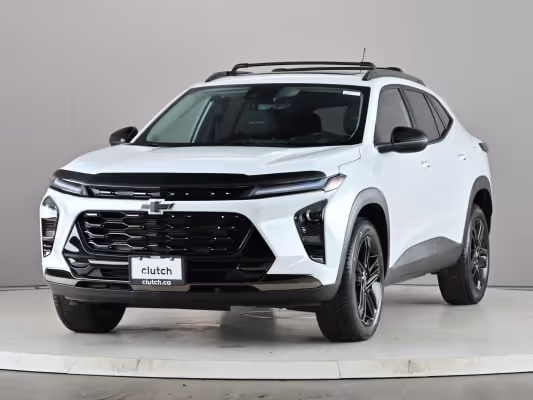
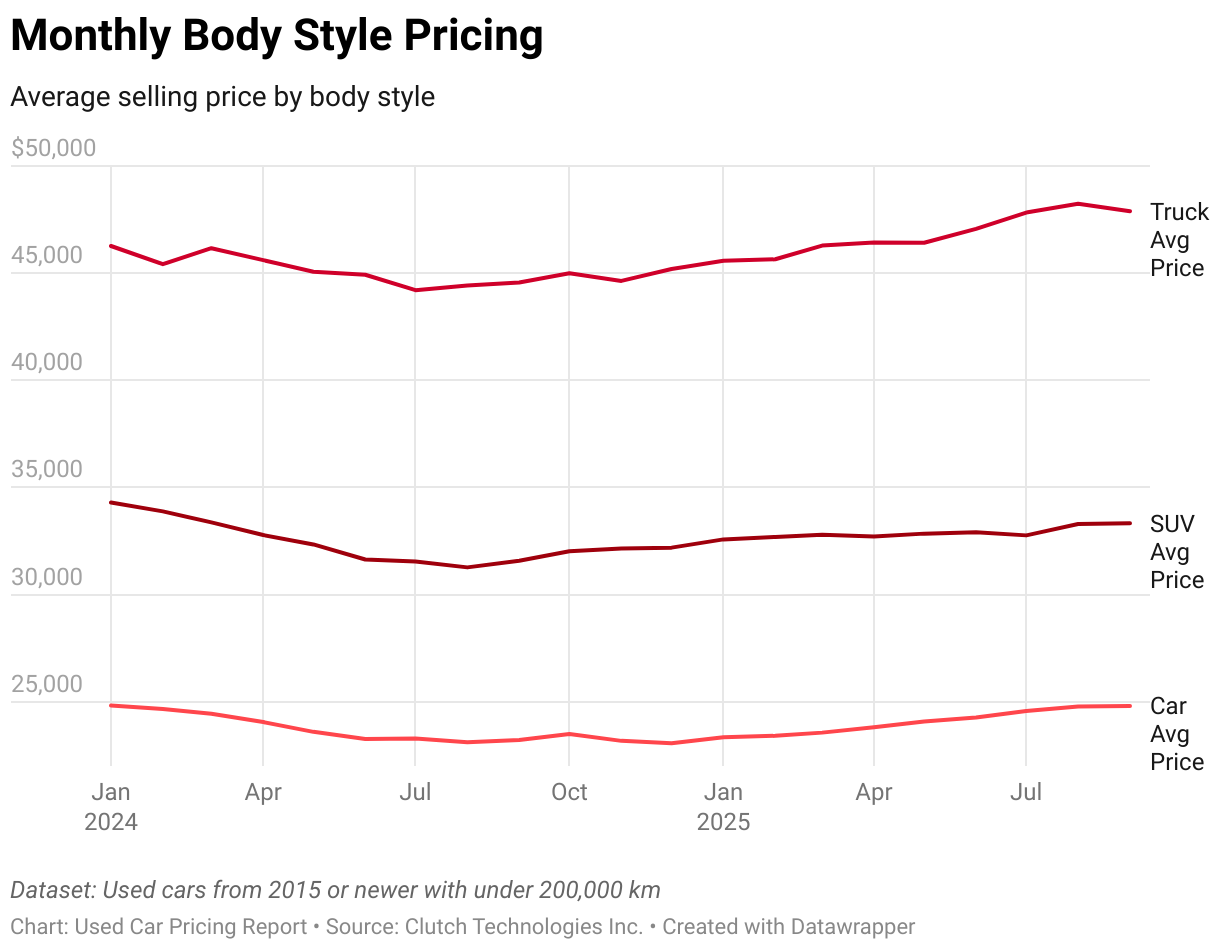
The September body style story is less about pricing swings and more about sales composition. Trucks grew their share of the national market from 13.7% in August to 15.0% in September, with the gains concentrated in Ontario, BC, Alberta, and Quebec. Cars gave up ground (-1.2pp nationally), while SUVs held roughly steady. Prices for cars and SUVs barely moved month to month, and unlike the fuel type categories, the within-model vs. mix effects were fairly muted.
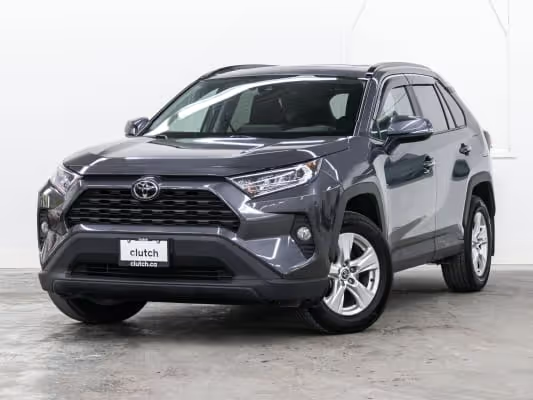
SUVs
The average selling price for SUVs climbed to $33,240 in September 2025, up $1,707 YoY. Both mix and within-model dynamics contributed: buyers leaned toward higher-priced crossovers, while transaction prices across many models were higher than a year ago.
- Mix (up): +$1,158 YoY. Example: Toyota RAV4 and Hyundai Tucson captured more share relative to less expensive alternatives.
- Within-model pricing (up): +$549 YoY. Example: BMW X5 held firmer transaction prices compared to last year.
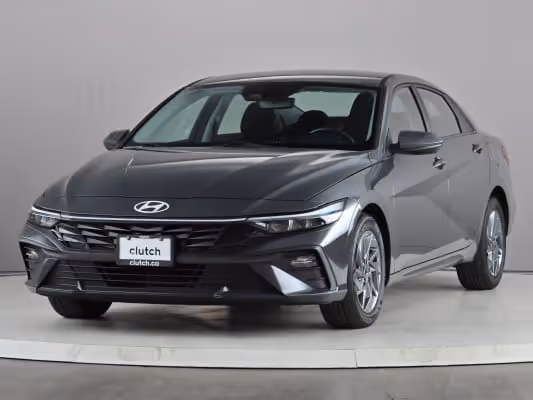
Cars
Car ASPs reached $24,913, up $1,762 YoY. This move was almost entirely about mix: compact staples like the Toyota Corolla, Honda Civic, and Mazda3 took a larger share of sales relative to lower-priced sedans, adding $1,790 to the segment average. Like-for-like pricing was unchanged to slightly softer.
- Mix (up): +$1,790 YoY. Example: Corolla and Civic gained share while the Hyundai Elantra lost ground.
- Within-model pricing (flat): -$28 YoY. Example: Tesla Model 3 transacted at lower prices than last year.
Trucks
Trucks led the way in absolute price growth, with the national ASP rising to $47,892 (+$3,334 YoY). The vast majority of that increase came from within-model pricing, as pickups like the Ford F-150, Ram 1500, and GMC Sierra commanded several thousand dollars more on average than a year ago. Mix added only modestly.
- Mix (up): +$140 YoY. Example: Chevrolet Silverado’s share increased, pulling prices up.
- Within-model pricing (up): +$3,194 YoY. Example: Ford F-150 and Ram 1500 each transacted at higher average prices than in September 2024.
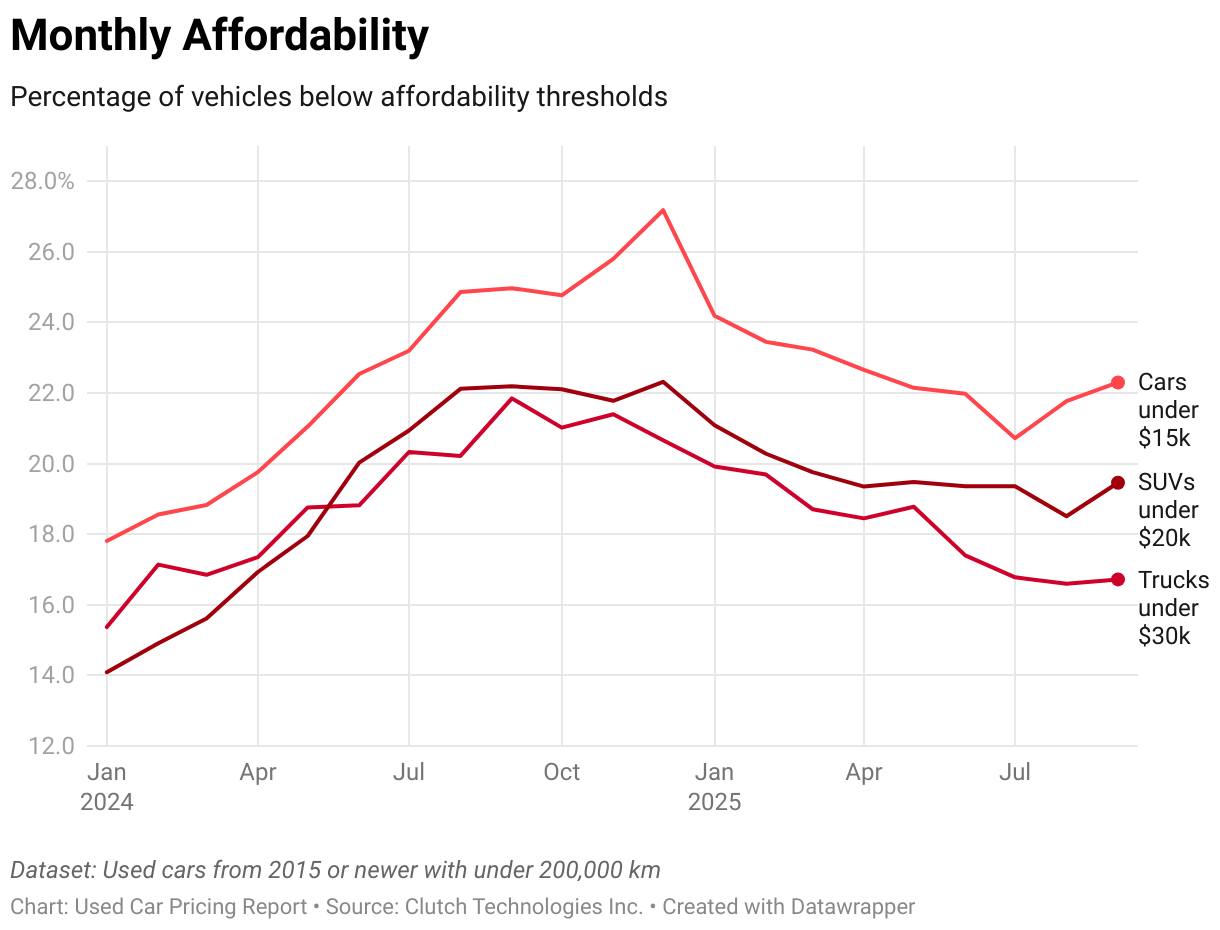
The relationship between affordability and average selling price has evolved quite a bit since early last year. Prices today are almost exactly where they stood in January 2024, a time when affordability was very low. Then, through the first two quarters of last year, prices eased, and by September 2024, affordability had improved considerably. Over the last twelve months, however, prices have climbed back up to January 2024 levels. Despite the pricing parity with January 2024, affordability is actually considerably better than it was then. Let’s examine how that came to be.
From Jan 2024 to Sep 2024: Prices Fell, Affordability Improved
- Average prices dipped:
- Cars: $24,822 → $23,210 (-6.5%)
- SUVs: $34,299 → $31,582 (-7.9%)
- Trucks: $46,266 → $44,560 (-3.7%)
- More vehicles in affordable bands:
- Cars under $15k: 17.81% → 24.97% of sales
- SUVs under $20k: 14.09% → 22.19%
- Trucks under $30k: 15.37% → 21.85%
The mid-2024 market was the “most affordable” point in this cycle—prices had drifted lower, and older, cheaper vehicles made up a bigger share of transactions.
From Sep 2024 to Sep 2025: Prices Rebounded, Affordability Slipped
- Average prices rose back to Jan 2024 levels:
- Cars: $24,795 (+$1,585 YoY, nearly identical to Jan ’24)
- SUVs: $33,329 (+$1,746 YoY, close to Jan ’24)
- Trucks: $47,886 (+$3,326 YoY, slightly above Jan ’24)
- Affordability pulled back vs. last year, but stayed above Jan 2024:
- Cars under $15k: 22.30% (down from 25% YoY, up from 18% in Jan ’24)
- SUVs under $20k: 19.46% (down from 22% YoY, up from 14% in Jan ’24)
- Trucks under $30k: 16.72% (down from 22% YoY, up from 15% in Jan ’24)
Affordability is now higher than in early 2024, but lower than last year’s peak.
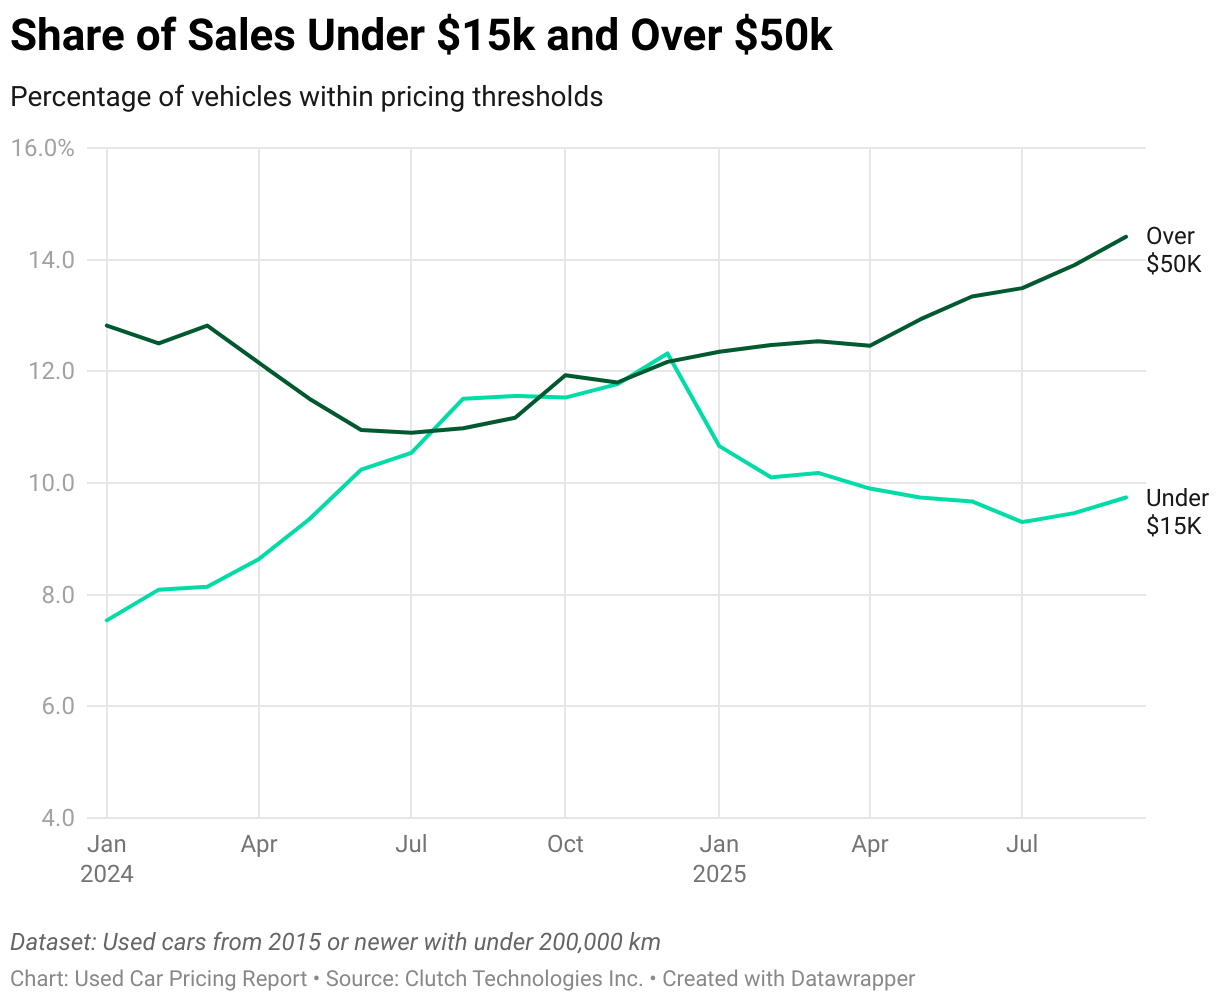
Polarization at the High End
- Share of sales above $50k:
- Cars: +1.3pp YoY
- SUVs: +1.9pp YoY
- Trucks: +8.8pp YoY
- Average price within >$50k tier:
- Cars: +$2,773 YoY
- SUVs: +$2,071 YoY
- Trucks: -$169 YoY
Trucks are growing the expensive tier through share gains, while cars and SUVs are making the tier more expensive on a per-unit basis.
Why This Is Happening
- Affordable vehicles (≤$15k): This group has had strong supply because the cars are older, averaging 7-8 years, and were less affected by pandemic production shortages.
- Expensive vehicles (>$50k): These cars are newer, averaging 2-3 years, drawn from post-pandemic model years with higher MSRPs. In January 2024, supply was thinner, and it has slowly been growing as the post-pandemic cohort hits the used market.
So while the share of affordable vehicles has improved compared to January 2024, prices are just about the same because the share of newer, more expensive vehicles in the used market has grown as well.
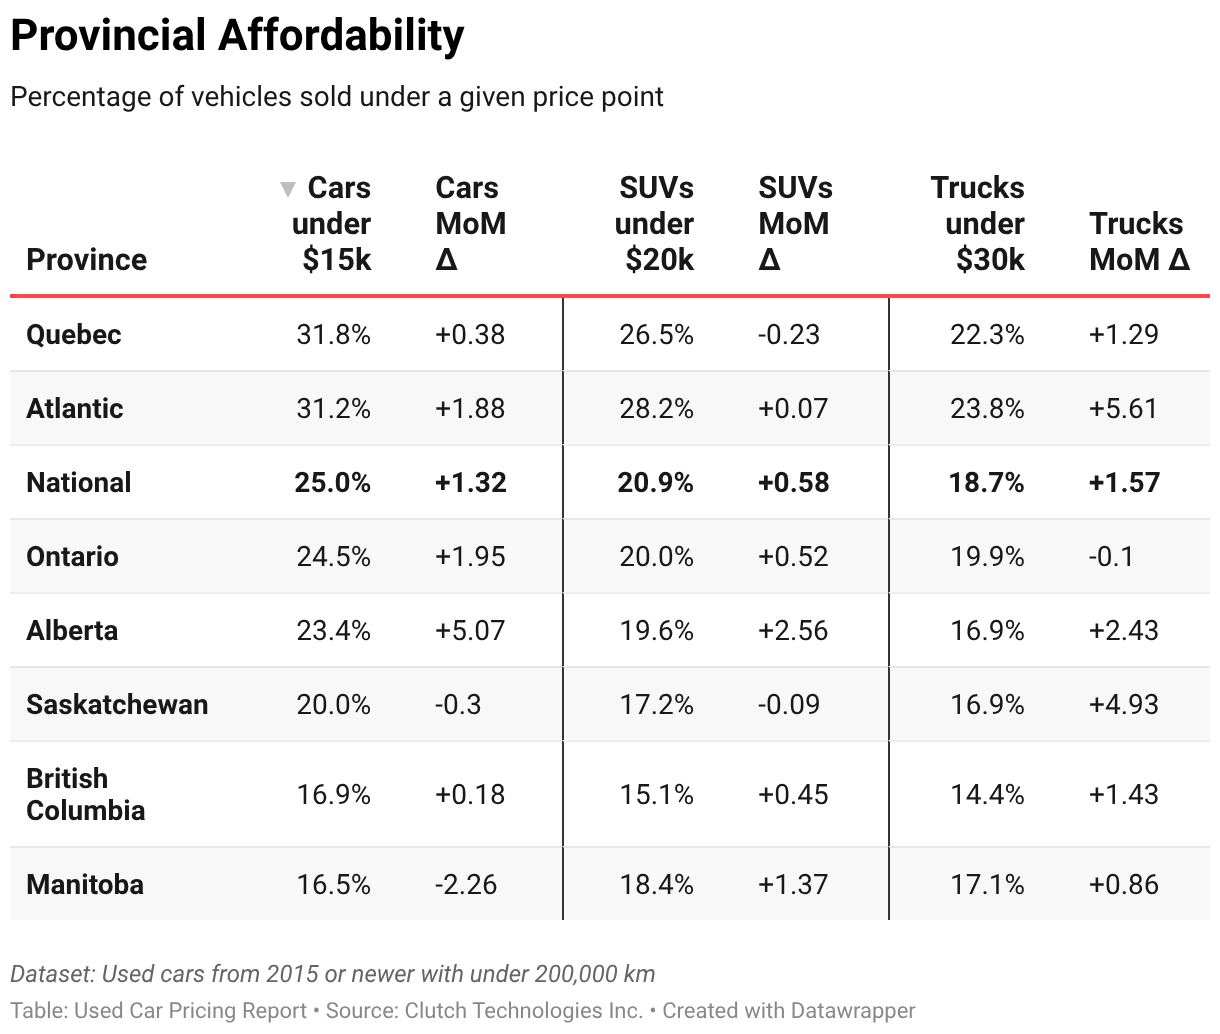
Affordability ticked higher across most regions in September, though the levels remain uneven province to province.
- Atlantic provinces continue to stand out as the most affordable across all body styles, and affordability shares increased further this month.
- British Columbia, the least affordable region, also saw improvements in affordability, led by gains in the SUV and truck categories.
- Quebec remains relatively strong, though trucks were an exception—affordability in that segment slipped slightly.
- Across the rest of the provinces, affordability edged up across most categories, pointing to broad-based improvement compared with August.
ASP vs Affordability Contrasts
In several regions, affordability bands grew even as average selling prices rose. This reflects the compositional shift toward more growing sales in the higher price bands, especially in the >$50k bracket. In the following categories, both affordability and ASP increased:
- Atlantic Cars and SUVs
- Ontario SUVs
- Quebec Cars
These contrasts illustrate how affordability improvements are less about the whole market coming down in price and more about accessibility to lower-priced vehicles.
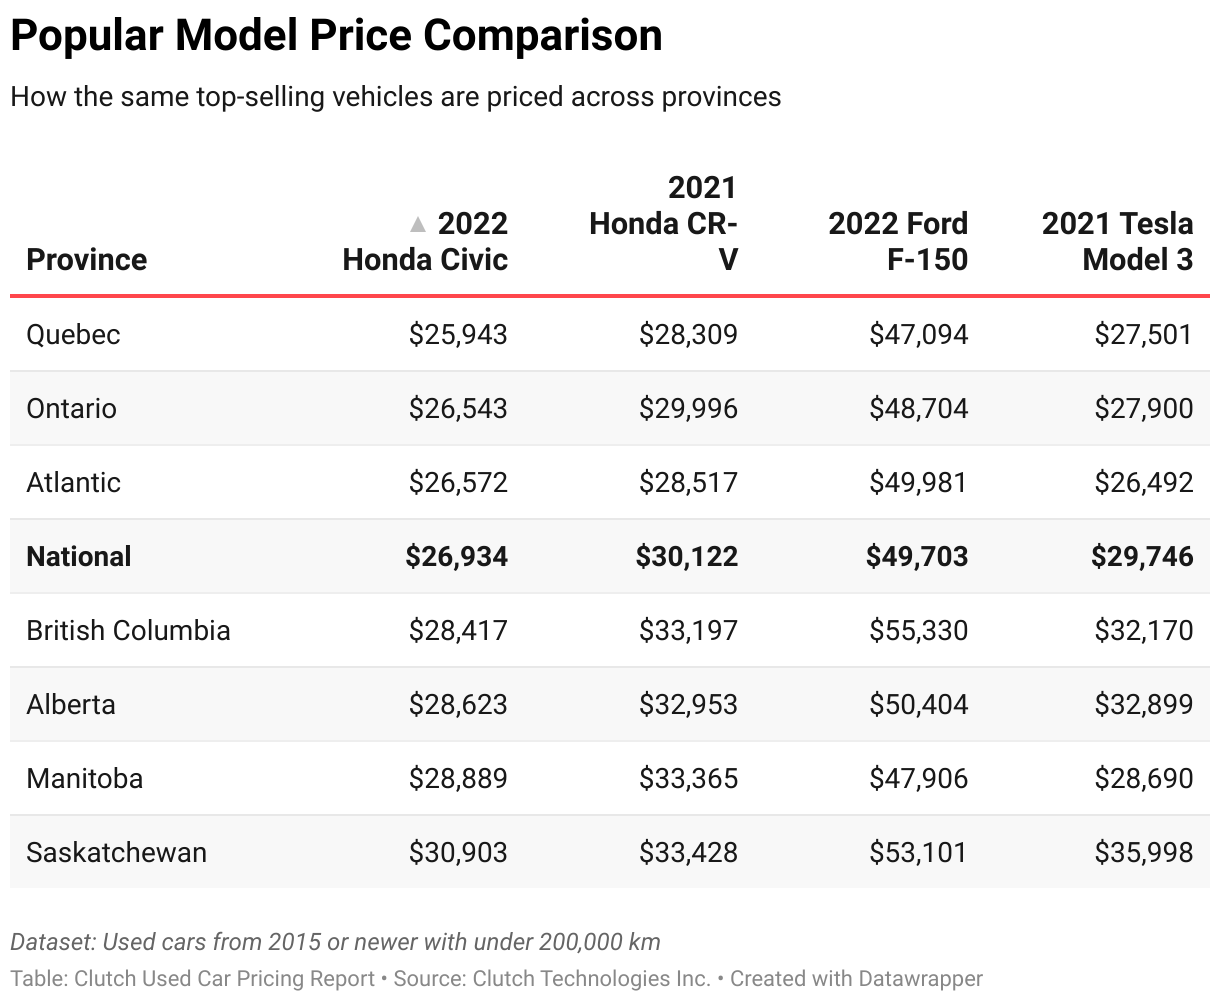
A new lens this month looks at the top-selling models in each major segment—cars, SUVs, trucks, and EVs—and how their prices compare across provinces. Unlike body-style or fuel-type comparisons, which reflect differences in what each market is buying, this method holds the model constant. It’s a like-for-like view that strips away much of the mix effect and gives a clearer sense of whether the same vehicle costs more in one province than another.
Both views matter. Body style and fuel type comparisons show how market composition drives affordability—BC looks expensive on SUVs because it sells more premium crossovers, for instance. Year-make-model comparisons, on the other hand, reveal whether a popular benchmark like a Honda CR-V or Ford F-150 is actually pricier in one region than another. Together, they give a fuller picture of how affordability plays out.
Key Divergences
- Ontario vs Atlantic (Civic & CR-V): Provincial averages suggest Ontario is far more expensive than Atlantic across cars and SUVs. Yet when you compare like-for-like, Civics and CR-Vs cost about the same in both regions. Ontario’s premium is largely a mix effect, not higher prices for the same models.
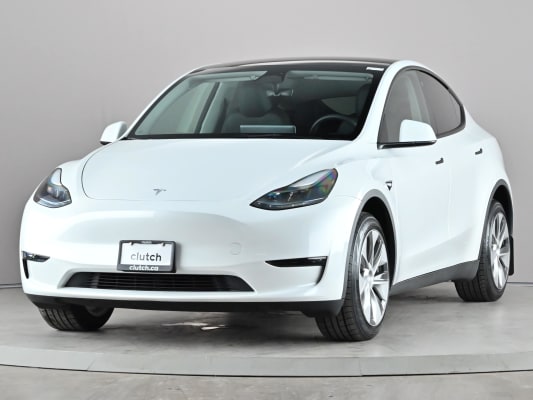
- BC vs Ontario (Model 3): EV averages imply Ontario is the pricier market, but the Tesla Model 3 tells a different story. It actually costs more in BC than in Ontario, showing that Ontario’s higher EV average comes from a greater share of costly crossovers and performance EVs, not the entry-level EV most buyers choose.
- Atlantic/Ontario vs Alberta (F-150): Truck averages make Atlantic and Ontario look like cheaper markets than Alberta. But the Ford F-150, the benchmark truck, sells for nearly the same price in all three. Atlantic’s “cheaper truck market” is mostly a mix effect—buyers there lean into smaller or older trucks, while the flagship F-150 costs as much as anywhere else.
- Tesla Model 3 vs EVs (general): Across all provinces, the 2021 Model 3 consistently transacts 20-40% below the provincial EV average. It anchors EV affordability in a way that the category-level view hides, because EV averages are skewed by expensive luxury entries.

This month’s Market Makers compare the top three models priced above $50k in each category to last year’s top three, showing their share of sales and average selling price. The results reinforce that national ASP increases are being driven by the growth of this tier, not by broad-based price hikes across all vehicles.
Top 3 Cars >$50k
- Share of sales: grew from 0.47% in Sep 2024 → 0.67% in Sep 2025.
- ASP of top three: rose sharply from $65,171 → $95,178 (+46%).
- Takeaway: Even though cars >$50k remain a small slice, this segment is growing and expensive models like the Taycan are leading the charge, pulling up ASP for both cars and EVs.
Top 3 SUVs >$50k
- Share of sales: expanded from 0.78% → 1.10%.
- ASP of top three: increased from $65,929 → $71,217 (+8%).
- Takeaway: The SUV market is feeling a double push: a larger slice of sales in this tier and higher transaction prices within it.
Top 3 Trucks >$50k
- Share of sales: climbed from 9.8% → 14.0%.
- ASP of top three: softened slightly, from $64,324 → $63,322 (-2%).
- Takeaway: Trucks are a volume story—the share of >$50k units surged, and even with slightly lower ASPs inside the tier, that weight is enough to lift the overall truck average higher.
Together, these trends underline the broader thesis: it’s the growth of expensive vehicles that is driving ASPs higher, not across-the-board price inflation.
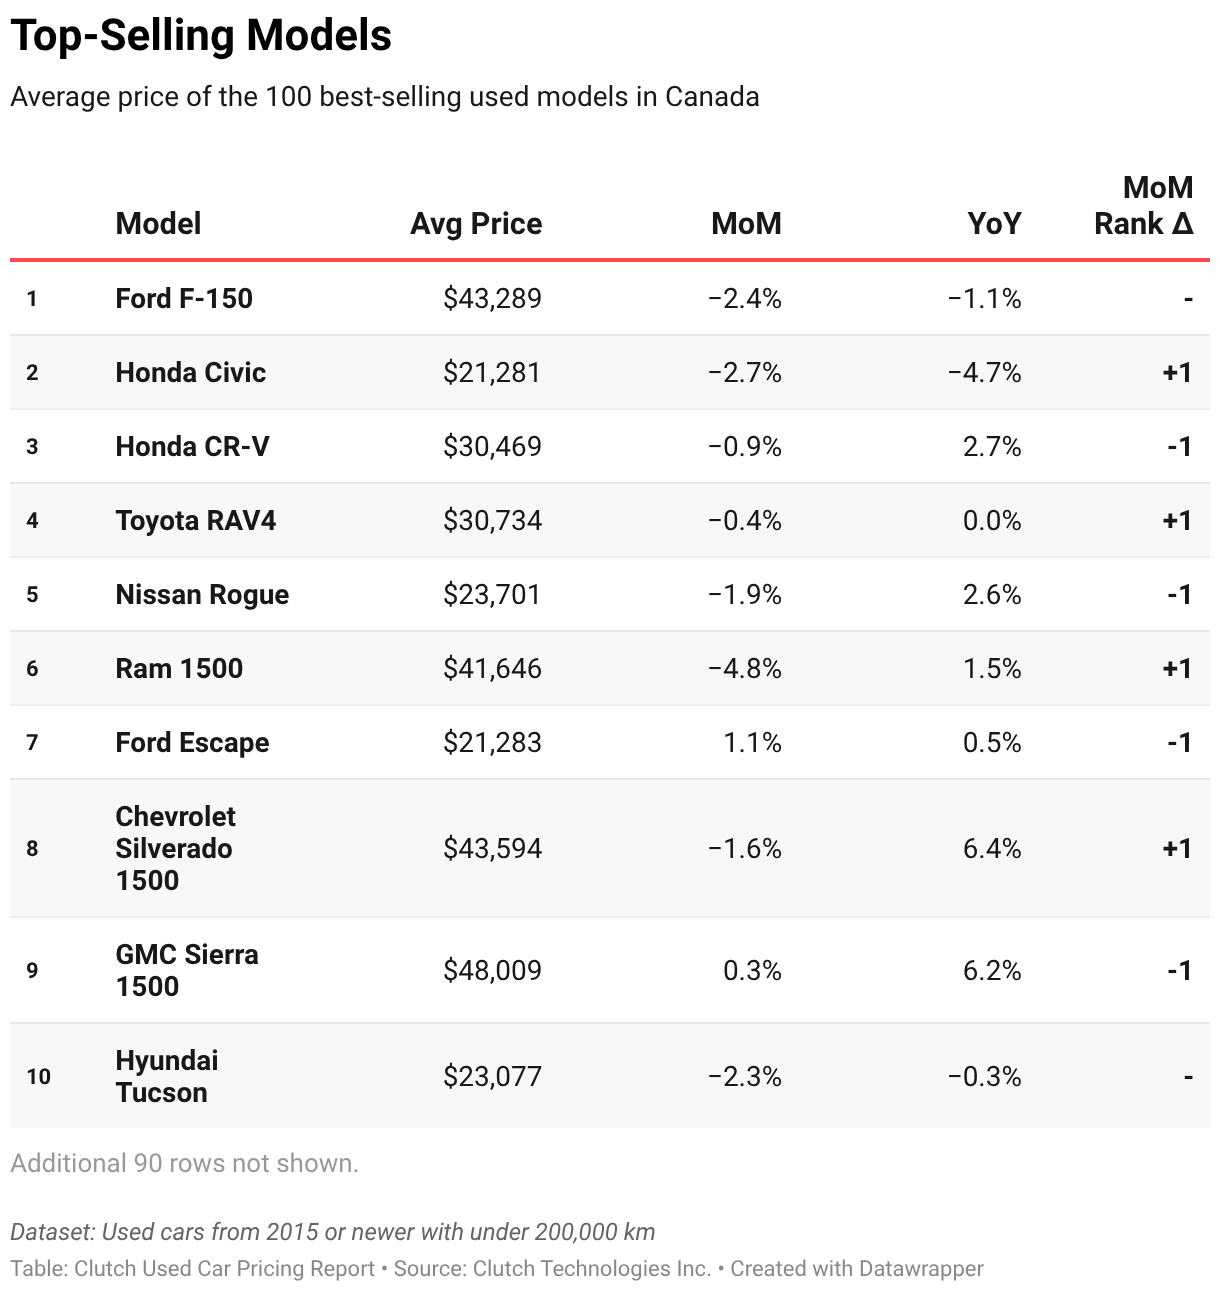
September’s leaderboard shuffled in ways that mirrored the month’s broader story. The Honda Civic, last month’s overall leader, slipped from the top spot, making room for the Ford F-150 to reclaim #1. That shift was reinforced further down the list, as the Ram 1500 and GMC Sierra 1500 entered the top 10. Together, those moves reflect the broader rebound in truck share that pushed gasoline vehicles higher and shaped the month’s national averages.
Compact SUVs held steady. The Honda CR-V and Toyota RAV4 remained firmly entrenched in the upper ranks, underscoring their role as consistent anchors at the more affordable end of the market.
Electrified models, by contrast, gave back ground. The Tesla Model 3 and Model Y both dropped in the rankings, which allowed for more premium EVs to take up the slack.
Final Takeaways & What’s Next
September reinforced the central theme of today’s used market: average prices are being pulled higher not by across-the-board inflation, but by the changing composition of what’s selling. Trucks gained share, the >$50k bracket widened further, and newer late-model vehicles continued to make up a larger slice of transactions. At the same time, affordability remains stronger than it was at the start of 2024, thanks to steady availability of older, lower-priced vehicles.
Looking ahead, the push-and-pull dynamic is likely to persist. Trucks typically gain share heading into late fall and winter, a seasonal pattern that will only strengthen their influence on national averages. The >$50k tier will continue to grow in both size and ASP, keeping upward pressure on the national line.
Electrified vehicles should also reassert themselves. EV and hybrid share dipped in September, but both are expected to bounce back and continue their long-term upward trajectory. EV affordability, in particular, is likely to improve further as mainstream models like the Model 3 hold lower transaction prices relative to premium entries. The coming months will also bring clarity on the federal EV mandate review, which could shape availability and adoption patterns heading into 2026.
In short, the road ahead looks like more of the same: a polarized market where both the affordable base and the expensive top tier are growing, and the balance between them sets the course for national averages. In the long term, the expensive tier will pull ahead.
{{widget-1}}

About This Data
This report is based on Clutch’s internal data, collected from retail vehicle sales reported across Canada. The analysis includes vehicles that meet the following criteria:
- Model year 2015 or newer
- Less than 200,000 km at the time of sale
- Sold vehicles only
References to “cars” include both sedans and hatchbacks, while SUVs and trucks are categorized separately. This segmentation helps reflect real-world buyer preferences across different body styles.
While the dataset covers a large national sample, pricing in smaller provinces or regions with lower sales volume may be influenced by individual outliers. This can lead to greater month-over-month fluctuations in certain areas compared to larger markets like Ontario, Quebec, and British Columbia.
The figures presented reflect average asking prices at the time of sale and are designed to provide an accurate snapshot of current market trends.
.avif)


.avif)
-02.avif)